Device Dashboard
The overview for a specific device includes detailed information for the device, a map of the device, and several KPIs and widgets that track metrics for the device.
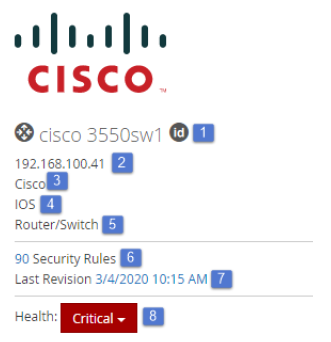
The panel that displays device information is on the top left side of the device dashboard. See the table below for definitions of the panel items.
| Item | Definition |
|---|---|
| 1 | Device name and ID. Click the ID icon to view. |
| 2 | Device IP address |
| 3 | Device vendor |
| 4 | Device type |
| 5 | Device type |
| 6 | The number of security rules in the device policy |
| 7 | The date and time of the last revision |
| 8 |
A visual representation of the device's health. We return health check results based on the worst case scenario. Click the arrow to view Health Check Results.
|
 Healthy—no critical issues or warnings were discovered within the test suites
 Warning—no critical issues were discovered but at least one warning was discovered within the test suites
 Critical—at least one critical issue was discovered within the test suites
Device Map
The device map appears to the right of the device information panel.
- Within the map you can zoom in or out.
- Click Full Map to open the map in a new page within Topology.
- Click Device APA to open the map in Access Path Analysis.
Device KPIs
- Device SCI—the ratio of failed severity checks to total number of severity checks
- Configuration Changes—the number of configuration changes to the device configuration. Raw file changes are not included in this count
- Device Complexity—a percentage that measures the complexity of a device's firewall rule configuration. Every new component a network administrator adds to a network - such as a group member, host, network, or service - adds to the device complexity. The higher the device complexity, the greater the risk of a configuration error
- Rules with Critical Control Failures—the number of rules in the device with critical control failures. A control failure is critical if it has a severity value of 8 or higher
Device Widgets
- Most Severe Control Failures—a table that lists controls that have failed across the highest percentage of devices
- Rule Search
- Frequent Sources—the sources which have the largest number of hits in the last 30 days for the device
- Frequent Destinations—the destinations which have the largest number of hits in the last 30 days for the device
- Rule Usage by Cumulative Severity—a bar graph that displays the ratio of low, high, and critical rule severity among unused, heavily used, moderately used, and lightly used rules, as well as rules for which limited data is available
- Logged Connections (30-day History)—a line graph that lists the number of rules that were used on each of the last 30 days
- Traffic Flow Analysis (Last 10)—the last 10 flow profiles that have been run against this device
- Rules Recently Changed (Last 10)—the last 10 changes to the rule set for the device