Insights Dashboard
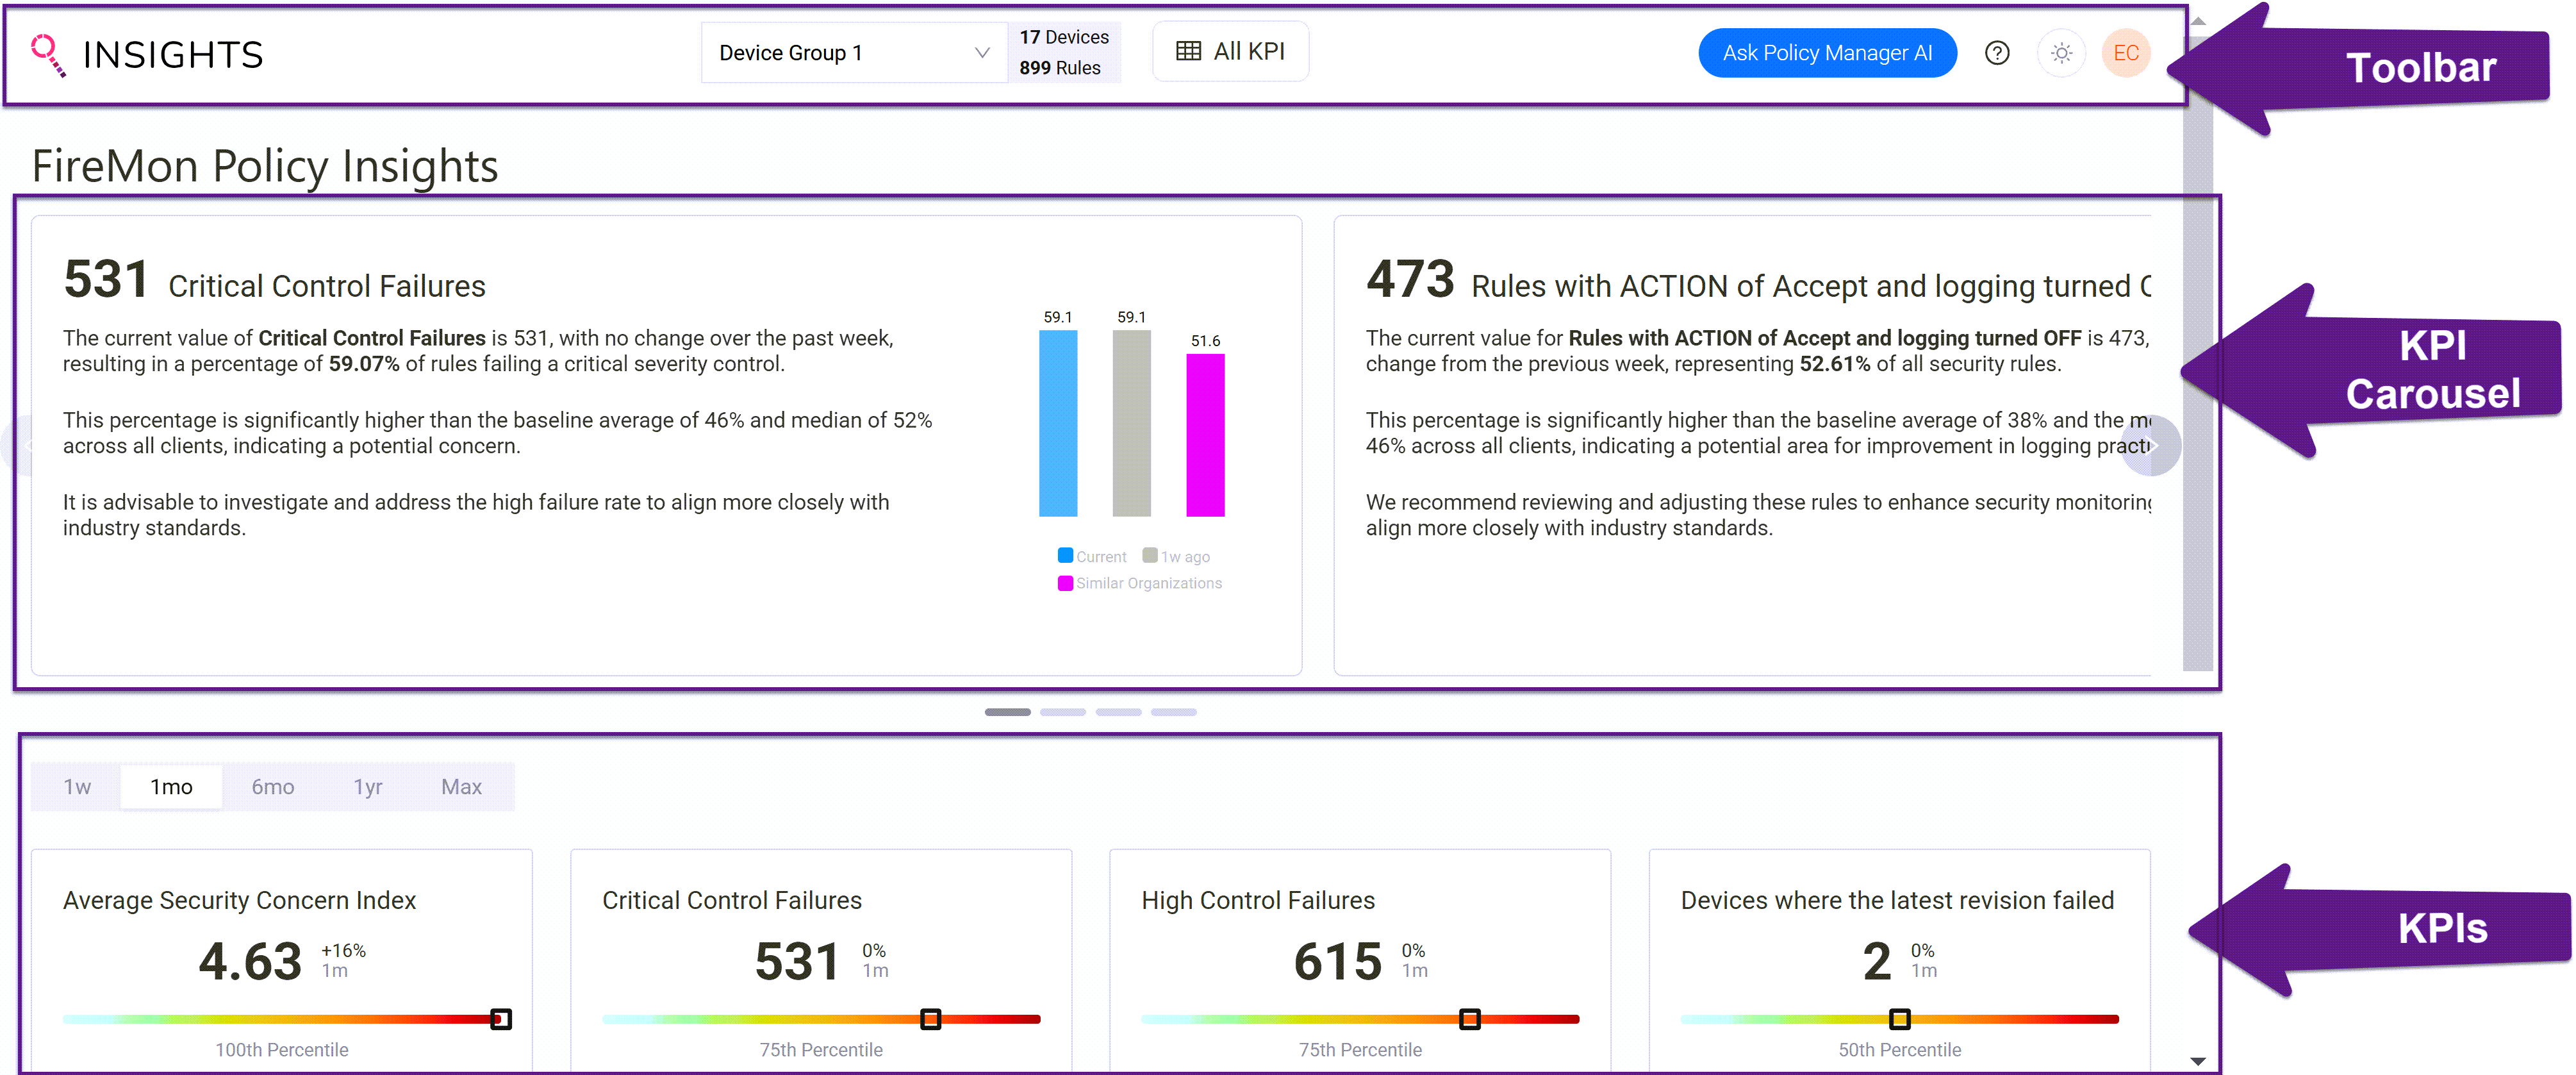
When you open FireMon Insights, you'll notice three main sections of the dashboard:
-
Toolbar—used to navigate the module.
-
KPI Carousel—an overview of your four most-valuable metrics based on AI selection.
-
KPIs—customizable section to quickly see the data most important to you.
Toolbar
From the Insights toolbar, you can:

-
Select the device or device groups for analysis from those Insights has retrieved from SIP. The selection will include the number of devices in and the number of rules associated to the device or device group.
-
Quickly access the All KPI list table.
-
Ask AI a questions such as firewall policy SIQL query responses (policy rule data) and network APA responses (questions about network access between individual IP addresses and ports).
-
Click the Question mark icon to take a quick tour of FireMon Insights.
-
Click the Brightness icon to adjust background settings.
-
Click the User icon and then select:
-
About the signed in user and Insights version.
-
Sign Out to quit the module.
-
KPI Carousel
Scroll left or right to view a more in-depth snapshot of what AI considers the most-valuable insights. You can click each KPI carousel to open it's KPI page.
At this time, the KPI carousel is not customizable.
Trend Color-coding
Each of the four KPI carousels have a colored bar chart, displaying the specific count above each bar.
 —Current
 —1 week ago
 —Similar Organizations is based on comparison to other customers of the same metric